The debugger allows finding and fixing issues with Scripts or Templates written for 010 Editor. Using the debugger, execution of a Script or Template can be stepped line by line and the value of each variable examined after each line. Many of the debugging operations can be controlled using the Debug Menu.
Starting and Stopping the Debugger
By default the debugger is always enabled in 010 Editor but can be turned on or off by clicking the 'Debug > Debugging Enabled' menu option. If a checkmark is displayed beside the Debugging Enabled option then debugging is enabled and if an 'X' is displayed then debugging is disabled. Any time a Script or Template is run (see Running Templates and Scripts) and debugging is enabled, the debugger automatically monitors for breakpoints. If a breakpoint is hit then the program execution pauses at the breakpoint and the debugger is started. Scripts or Templates can also be run by selecting a Script or Template in the editor and clicking the 'Debug > Start Debugging' menu option. Note this is equivalent to using 'Scripts > Run Script' when a Script is selected or 'Templates > Run Template' when a Template is selected, or clicking the Run button in the top-right corner of a Template or Script editor. Debugging can only occur on one Script or Template at a time and the current Script or Template must finish before another Script or Template can begin.
Another method of starting the debugger is to select a Script or Template and then click the 'Debug > Step Into' menu option. This option starts execution of the program but pauses at the first executable line of the program and starts the debugger. Also the debugger can be started by right-clicking on a Script or Template in the Text Editor and choosing Run to Cursor from the right-click menu. This option attempts to run the Script or Template until the selected line is reached at which point the execution is paused and the debugger is started.
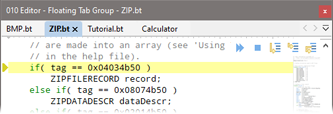
When program execution is paused the current line is marked with a yellow arrow as displayed in the figure above. By default, icons for the debugger are overlaid onto the editor in the top-right corner but these buttons can be displayed in the Tool Bar instead by disabling 'View > File Bar > Show Overlaid Debug Icons' and enabling 'View > Tool Bars > Debug'. To continue execution of the program click 'Debug > Continue', or use 'Scripts > Continue Script or Template' or 'Templates > Continue Script or Template', or click the double-arrow icon in the top-right corner. The debugger can also be stepped to another line as discussed in the Stepping Through Scripts or Templates section below. Program execution can be paused by clicking the 'Debug > Pause' menu option while a Script or Template is running or by clicking the Pause button in the Tool Bar. Pausing a Script or Template pauses the program, places the cursor at the next line to be executed and starts the debugger.
To stop a Script or Template which is running or paused click the 'Debug > Stop Script/Template' menu option or press the keyboard shortcut Shift+Esc. Scripts or Templates can also be stopped using 'Scripts > Stop Script' or 'Templates > Stop Template' which only appear when a Script or Template is running. When paused or at a breakpoint, the Stop icon in the top-right corner of the editor can be clicked to stop the Script or Template. Stopping a Script or Template which is currently paused at a breakpoint resets the debugger.
Breakpoints
A breakpoint is a line in a Script or Template the debugger will pause at when execution reaches that line. Breakpoints can be set by moving the cursor to the requested line in a Script or Template and clicking 'Debug > Toggle Breakpoint'. Click Toggle Breakpoint on a line which already contains a breakpoint to remove that breakpoint. Alternately breakpoints can be set or removed by single-clicking with the mouse in the address column on the left side of each Text Editor. In the address column a number of symbols can appear:
 - Indicates a breakpoint is set at this line. - Indicates a breakpoint is set at this line.
 - Indicates the debugger is currently at this line. - Indicates the debugger is currently at this line.
 - Indicates the debugger is currently at this line and the line also contains a breakpoint. - Indicates the debugger is currently at this line and the line also contains a breakpoint.
 - Marks a breakpoint which will not be hit because debugging is turned off. Debugging can be turned on by clicking 'Debug > Debugging Enabled'. - Marks a breakpoint which will not be hit because debugging is turned off. Debugging can be turned on by clicking 'Debug > Debugging Enabled'.
 - Marks a breakpoint which will not be hit because the Script or Template has been modified since execution began. Use 'Debug > Stop Script' or 'Debug > Stop Template' and then rerun the Script or Template to hit the breakpoint. - Marks a breakpoint which will not be hit because the Script or Template has been modified since execution began. Use 'Debug > Stop Script' or 'Debug > Stop Template' and then rerun the Script or Template to hit the breakpoint.
Hovering the mouse cursor over one of the above symbols in the Text Editor will also give information about the symbol in a hint popup. A list of all set breakpoints for the current Script or Template is available in the Breakpoints tab. The Breakpoints tab is located in a tab group with the Inspector and the '<' or '>' arrows may be used to locate the tab, or click 'Debug > View Breakpoints'.

Inside the Breakpoints tab is a list of the line numbers for each breakpoint in the file. Right-click on the Breakpoints tab and choose Add Breakpoint to set a breakpoint by line number. Select a breakpoint and choose Remove Breakpoint to delete the breakpoint from the file. Double-clicking on a breakpoint in the list will jump the mouse cursor to that line in the editor. Note that breakpoints are persistent, meaning they are saved to disk and reloaded when 010 Editor is shut down and restarted (this behaviour can be turned off using the Compiling Options dialog). To delete all breakpoints in all files use the 'Debug > Delete All Breakpoints' menu option.
Note that breakpoints are currently not hit when 010 Editor is starting up and reloading files that were previously opened. To hit a breakpoint in a Script or Template rerun the Script or Template after 010 Editor has finished starting up. If a breakpoint is set on a line which cannot be executed (e.g. a comment) then the breakpoint will be moved to the next line that can be executed when the Script or Template is run.
Stepping Through Scripts or Templates
Once the debugger has paused at a line in a Script or Template there are three ways to step to the next line, all of which can be access on the Debug Menu or as icons in the top-right corner of the editor:
- Step Over - Advances to the next line of the file. If the current line contains a function or struct then all the statements inside the function or struct are executed without stopping.
- Step Into - Advances to the next line of the file. If the current line contains a function or struct the debugger pauses at the first line of the function or struct. This menu option can also be used before a Script or Template has started to start the debugger and pause at the first line that can be executed.
- Step Out - If program execution is paused at a line inside a function or struct, all the rest of the lines within the function or struct are executed and the debugger pauses at the first line outside of the function or struct.
If stepping to a line which is inside an included file, the included file will be opened automatically.
Investigating Variables
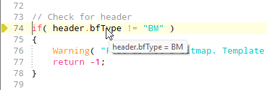
When program execution has paused at a line a number of ways exist to the check the value of different variables. The first is to place the mouse cursor over a variable name in the Text Editor and the value of the variable will be displayed in a hint popup as shown above. This is called a Variable Hint and can be turned off using the Compiling Options dialog. Currently the variables inside a struct cannot be viewed using this technique and to view the contents of a struct use the Quick Watch dialog. Simple expressions can also be evaluated by using a mouse-over. Select the expression to evaluate in the Script or Template and then place the mouse cursor over the selection. If the expression can be evaluated the result is displayed in a hint popup above the selection. Only simple functions such as sizeof, startof, exists, etc. can be evaluated using a hint but if the expression contains complex functions use the Quick Watch dialog.

When debugging a Template the list of created variables can be viewed in either the Template Results or the Variables tab in the Inspector as shown in the above figure. When debugging a Script the list of variables can only be viewed in the Variables tab. Note that when viewing the created variables for a Template sometimes the local variables are hidden and to display them right-click on the Template Results or Variables tab and choose Show Local Variables.
The final way to view the values of variables is to use watches as detailed in the following sections.
Watches
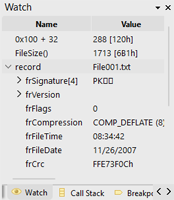
A watch is an expression which is evaluated every time program execution pauses at a line in a Script or Template. The list of watches is located in the Watch tab of the Inspector as shown in the above figure. Locate the Watch tab by pressing the '<' or '>' arrows in the Inspector or by clicking 'Debug > View Watches'. New watches can be added to the list by double-clicking on the first empty cell in the Name column or by right-clicking on the Watch tab and selected Add Watch. Existing watches can be deleted by right-clicking on them and selecting Remove Watch or by using the Delete key. Note that all Scripts and Templates share a single list of watches.
Watches can contain almost any supported expression including arithmetic operations +,-,*,/, etc., built-in functions, and user-defined functions. If a watch evaluates to a single variable then the value of the variable is displayed in the Value column. If a watch evaluates to a struct then the whole struct is displayed and can be browsed similar to the Template Results or the Variables tab. Another way to view the value of an expression is to use the Quick Watch dialog.
Quick Watch

The Quick Watch dialog is used to view the value of almost any expression. When program execution has pause at a line in a Script or Template, the Quick Watch dialog can be opened by clicking the 'Debug > Quick Watch' menu option. Enter the expression to evaluate in the Expression field and click the Evaluate button or press the Enter key to evaluate the expression. The result of the expression is displayed in the Value column. Note that if a selection is made when the Quick Watch dialog is opened then the selection will be copied to the Expression field and evaluated immediately. If the result of the expression is a struct then the members of the struct can be browsed as using the Template Results or Variables tab. A list of previous expressions can be recalled by clicking the down arrow. Click the Add Watch button to add the expression in the Expression field to the Watch tab as described above. Click the Close button to exit the dialog.
Using the Call Stack
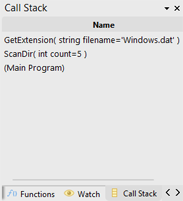
The Call Stack displays the list of functions or structs that have been executed in order to reach the current line in the debugger. The Call Stack tab only displays information when program execution has paused at a line in a Script or Template. Access the Call Stack tab using the '<' or '>' arrows in the Inspector or by clicking 'Debug > View Call Stack'. The current function or struct being executed is listed at the top of the Call Stack or '(Main Program)' is listed if no function or struct is being executed. The function or struct which called the function or struct listed on the top line is listed on the next line and so forth. For example in the above figure the main program called the function 'ScanDir' which then called the function 'GetExtension'. The arguments to the functions and their values when called are listed beside the function or struct name. Double-clicking on a function or struct name moves the cursor in the Text Editor to the last line in that function or struct that was executed.
When viewing a variable value using watches or by placing the mouse over variables names in a Script or Template, the results are calculated using the local variables from the function or struct listed at the top of the call stack. To instead use the local variables from a different function or struct, double-click on the function or struct name in the call stack. Double-clicking on a call stack item changes how watches, quick watches, and Variable Hints locate variables. Double-click the top item in the call stack to return the default behaviour.
Debugging Runtime Errors

When an error occurs in a Script or Template that is running, a dialog is displayed asking to start the debugger. Clicking the Debug button starts the debugger and places the cursor on the line that caused the error. Note that sometimes errors in Templates can occur because the data file was in a different format than expected or the data file contained invalid data. When the debugger is active, the values of variables can be queried, watches can be evaluated and the call stack checked. Stepping to the next line or continuing execution causes the Script or Template to stop. Clicking Ignore causes the Script to Template to stop without starting the debugger. If the error occurred in a Script or Template that is not loaded in the editor, the dialog will also have an option Load to open the file and view the line that caused the error. Enable the Always use this action toggle before clicking Debug or Ignore to always do the requested action when an error occurs. The action to perform can also be controlled using the Compiling Options dialog.
Debugging Read/Write Functions
Some Templates contain custom variables which can have special read, write, name or comment functions. These functions are called whenever data needs to be displayed in the Template Results panel or the Variables tab. When the Template Results or Variables tab call these functions, they are run in a separate thread meaning that any breakpoints inside the read/write/name/comment functions will not be hit; however, if these functions are called directly inside the Script or Template then breakpoints will be hit. If debugging needs to be done on these custom functions then call them directly at the end of the Script or Template.
Debugging On-Demand Structures
On-Demand Structures are special structs which are not created until they are opened in order to save memory and time. An On-Demand Structure which is opened by using the Template Results or Variables tab is created in a separate thread, meaning that any breakpoints inside the structure will not be hit; however, if a Template accesses a variable inside an On-Demand Structure then it is created directly in the Template and breakpoints will be hit inside the structure. To debug On-Demand Structures access a variable inside the On-Demand Structure at the end of the Template.
Debugging Highlighting Functions
Some Templates contain Syntax Highlighters which are special functions used to apply coloring to text or hex files. Currently the HighlightLineRealtime and HighlightBytesRealtime functions are called in a separate thread, meaning that breakpoints inside those functions will not be hit. To debug the HighlightLineRealtime function, call the function directly inside the Template. For example to highlight the first 5 lines the following code could be used:
 #define MAX_LEN 1000
 local char    str[MAX_LEN];
 local int     line, count, foreColors[MAX_LEN], backColors[MAX_LEN];
 local ushort  flags;
 local wchar_t text[MAX_LEN];
 for( line = 0; line < 5; line++ )
 {
     count = TextReadLine( str, line, MAX_LEN, false );
     text = StringToWString( str );
     HighlightLineRealtime( line, text, foreColors, backColors,
       count, flags );
 }
|