

|
Pro text/hex editor
with Binary Templates
|
What's New in Version 10.0
SweetScape Software is pleased to announce 010 Editor v10.0 which includes a powerful debugger for finding and fixing problems with 010 Editor Scripts and Binary Templates. The debugger allows stopping at each line of a Script or Template and investigating the value of variables.
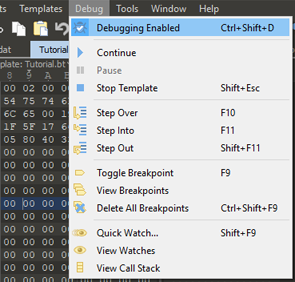
The yellow arrow indicates the current line being executed and can be stepped through the file. Red arrows indicate breakpoints and can be set by clicking on the address column of a Script or Template. Check the value of a variable by placing the mouse over the variable name when stopped at a line. Most of the debugger functionality can be controlled using the new Debug menu on the main menu:
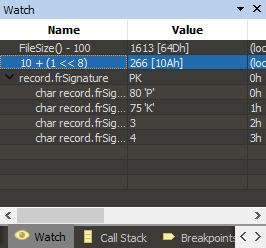
Three new tabs have been added to the Inspector tab group: Watch, Call Stack and Breakpoints. Watches can be added by double-clicking in the Name column and entering any expression and this expression is evaluated every time execution is stopped. The Call Stack shows which functions or structs were called to reach the current line and the Breakpoints tab lists all breakpoints in the current file.
When editing Text Files the line number and ruler labels are now hidden by default, but place the mouse cursor over the address column or ruler for a second to view the hidden information in a hint popup. Line numbers can be turned back on using 'View > Addresses > Show Addresses' and Ruler labels can be turned back on using 'View > Ruler > Show Labels'.
The Show Whitespace command ('View > Tabs/Whitespace > Show Whitespace') now shows symbols to indicate different types of linefeeds. The symbols displayed can be controlled with the Text Editor page of the Options dialog.

Plus much more. To download the latest version please click the following link:
See also:
- What's New in Version 9.0
- What's New in Version 8.0
- What's New in Version 7.0
- What's New in Version 6.0
- What's New in Version 5.0
- What's New in Version 4.0
|
|
Version 10.0.2 - May 1st, 2020
- Fixed on Windows a DLL was missing from the installer for older versions of Windows.
- Fixed on Linux the numlock key was not working properly.
- Fixed on Linux copying large blocks of data from some applications to 010 Editor did not work properly.
- Fixed on macOS the scroll bars in the Template Results were not updating properly in some cases.
- Fixed on macOS the repository was not updating properly when 010 Editor was installed as an admin.
- Fixed on macOS using Paste from Hex Text/Binary Text to paste data from certain applications to 010 Editor did not work properly.
- Fixed a slowdown in displaying find results when results occurred on a very long text line.
- Fixed some characters were incorrectly being combined when being rendered in the hex editor character area.
|
|
Version 10.0.1 - February 14th, 2020
- On macOS the application is now notarized.
- Upgraded to a new version of our user-interface library.
- Removed support for Windows XP, 32-bit macOS, and Ubuntu 10.04 to 15.10.
- Better support for high-DPI displays.
- Fixed a possible crash changing the text editor or hex editor font using the Options dialog.
- Fixed in the Find in Files results, sometimes the file names would be incorrectly truncated.
- Fixed a redraw issue when working with very large hex files and pressing Ctrl+A.
- Fixed Overwrite File was incorrectly removing bookmarks when data was modified.
- Fixed the Bookmark dialog was incorrectly truncating array sizes that were more than 4 GB.
- Fixed an incorrect status bar message displayed when hovering over the new file icon.
- Fixed the Register dialog was missing a Taskbar Icon if displayed before the main application started.
- Fixed the warning for running a template which generates a large number of variables was not being displayed.
- Added more checks a for corrupt configuration file on macOS.
|
|
Version 10.0 - December 6th, 2019
The following is an overview of the new functionality in version 10.0 of 010 Editor:
- A full debugger is now available for finding and fixing problems with Templates and Scripts.
- The debugger can be accessed using the Debug menu and includes stepping, breakpoints, watches and a call stack.
- Templates and Scripts are now threaded, meaning other editing operations can be done while a Template or Script is running.
- When using the Text Editor, line numbers and ruler labels are now hidden by default (they can be shown with 'View > Addresses > Show Addresses' or 'View > Ruler > Show Labels').
- When line numbers or ruler labels are hidden, hover the mouse over the address column or ruler for a second to display a hint popup with the hidden information.
- 'View > Tabs/Whitespace > Show Whitespace' now can be used to visualize linefeed types for each line.
The following is a list of all new features in version 10.0 of 010 Editor:
- Debugger
- A full debugger is now included for finding and fixing problems with 010 Editor Templates and Scripts.
- Added a new Debug menu for controlling the debugger.
- Debugging can be turned on or off using the 'Debug > Debugging Enabled' menu option.
- Debugger Program Flow
- Scripts or Templates can be run the usual way (for example with 'Scripts > Run Script' or 'Templates > Run Template') or by selecting a Script or Template and clicking 'Debug > Start Debugging'.
- If debugging is enabled and a breakpoint is hit in the Script or Template, program execution will pause (see the next section for information on breakpoints).
- When paused a yellow arrow will indicate the current debug active line in the Text Editor.
- Use 'Debug > Step Over' to step to the next line of the file, jumping over any functions or structs that are called.
- Use 'Debug > Step Into' to step to the next line of the file and step into any functions or structs that are called.
- Use 'Debug > Step Out' to execute the rest of the current function or struct and stop at the first statement outside the function or struct.
- To continue running a paused Script or Template click 'Debug > Continue', 'Scripts > Continue Script or Template' or 'Templates > Continue Script or Template'.
- To pause a running Script or Template click 'Debug > Pause'.
- To stop a running or paused Script or Template click 'Debug > Stop' or press Shift+Esc (note this has changed from the Esc key in previous versions).
- Scripts or Templates are now run threaded meaning other editing operations can take place when a Script or Template is running.
- If stepping to a line in an include file, the include file is automatically opened in the editor.
- Right-click on a Script or Template and choose Run to Cursor from the right-click menu. The Script or Template will run (or continue) and execution will stop at the chosen line or at the first breakpoint encountered.
- When a Script or Template is stopped, click 'Debug > Step Into' to start the program and stop at the first executable line.
- When stepping through a Template and the last line of the Template Results or Variables tab is selected, if any new variables are appended to the table then the selection will be moved to the last created variable.
- Breakpoints
- A breakpoint marks a line to stop in the Script or Template and is marked by a red arrow in the left-hand column of the Text Editor.
- Set or clear a breakpoint for the current line using 'Debug > Toggle Breakpoint' or by left-clicking the left-hand column in the Text Editor.
- If a breakpoint is set on a non-executable line then the breakpoint will be moved to the next line that is executable when the Script or Template executes.
- Breakpoints are persistent (saved to disk) but this can be changed using the Compiling page of the Options dialog.
- If debugging is disabled then no breakpoints will be hit and the breakpoints are displayed as red outlines in the Text Editor.
- If the Script or Template is modified when program execution is paused then breakpoints will be disabled. The breakpoints will be displayed as outlines with a solid arrow head.
- A list of all breakpoints can be found in the Breakpoints tab, which is found in the Inspector tab group or by clicking 'Debug > View Breakpoints'.
- In the Breakpoints tab, right-click on the table and select Add Breakpoint to set a breakpoint by line number.
- All breakpoints in all files can be deleted by clicking 'Debug > Delete All Breakpoints'.
- The color of breakpoints or the active line marker can be controlled using the Theme/Colors page of the Options dialog.
- Note that breakpoints are not hit when the application is starting up and any files are being reloaded.
- Variable Hints
- When program execution is paused and the mouse is placed over a variable name in the Script or Template, a hint popup will display the value of the variable.
- When a selection is made in the Script or Template and the mouse is placed over the selection, the selection will be evaluated and the results displayed in a hint popup.
- Currently only simple functions (sizeof, startof, exists, etc) can be evaluated in a selection and open the Quick Watch dialog to evaluate a selection which contains more complex functions.
- Note that how variables are scoped can be affected by the Call Stack tab.
- Variable hints can be turned off using the Compiling page of the Options dialog.
- Watches
- Watches can be set in the Watch tab found in the Inspector tab group or by clicking 'Debug > View Watches'.
- Add a watch by double-clicking on the first empty line in the Name column or by right-clicking on the Watch tab and choosing Add Watch.
- A watch can be almost any expression or variable name (for example, 'FileSize()-1000' or 'blocks[i].data[10]').
- Watches are evaluated every time program execution is paused (e.g. a breakpoint is hit) or when the program is stepped to the next line.
- If the result of a watch is a struct, the struct can be opened and explored similar to the Template Results.
- To delete a watch use the Delete key or right-click on a watch and choose Remove Watch.
- A single list of watches is kept for the entire application.
- Note that how variables are scoped can be affected by the Call Stack tab.
- Quick Watch
- Expressions can also be evaluated without creating a watch using the Quick Watch dialog ('Debug > Quick Watch').
- Enter an expression in the Expression field and click Evaluate.
- The result of the expression or variable is displayed in the Value column.
- A list of recent expressions is available by clicking the Down arrow in the dialog.
- Click the Add Watch button to add the current expression to the Watch tab.
- If a selection is made in the Text Editor before the Quick Watch dialog is opened, the selection is copied to the Expression field and evaluated.
- Debugging Runtime Errors
- If a runtime error occurs in a Template or Script a popup dialog box will be displayed asking to start the debugger.
- When debugging errors the cursor is placed on the line that caused the error.
- Variables can be investigated with Variable Hints in the Text Editor or with watches.
- Clicking Continue or stepping to the next line will stop the Script or Template.
- Select the Always use this action toggle in the popup dialog box to always start the debugger or never start the debugger.
- Whether the debugger starts on an error can also be controlled with the Compiling page of the Options dialog.
- Call Stack
- The Call Stack is available in the Call Stack tab which can be found in the Inspector tab group or by clicking 'Debug > View Call Stack'.
- When program execution is paused, the Call Stack lists the functions or structs that were called to reach the current execution point.
- The current function or struct is listed at the top of the call stack and the function or struct which called that function or struct is listed below it.
- If execution is not inside a function or struct then (Main Program) is listed in the call stack.
- Double-clicking on a function or struct jumps to the last position inside that function or struct.
- Double-clicking on a function or struct also makes any local variables inside the function or struct in local scope (this affects any watches or Variable hints in the Text Editor).
- Debugger Limitations
- Currently breakpoints are not hit inside custom read/write/name/comment functions that are called from the Template Results or Variables tab. To debug these functions call them directly inside the Template.
- Currently breakpoints in on-demand structures are not hit when the structure is created by opening it in the Template Results. To debug these functions trigger creation of the struct directly in the Template by accessing a variable inside the struct.
- Currently breakpoints are not hit inside the HighlightLineRealtime or HighlightBytesRealtime functions. To debug these functions see the Using the Debugger help topic in the manual for sample code to call.
- Templates and Scripts
- A full debugger including breakpoints, watches and call stack is now available for Templates and Scripts.
- Templates and Scripts are now threaded, meaning other editing operations can be done while a Template or Script is running.
- When a Template is running click 'Templates > Stop Template' or press Shift+Esc to cancel the Template.
- When a Script is running click 'Scripts > Stop Script' or press Shift+Esc to cancel the Script.
- On-demand Structures which have arguments are now supported.
- Custom read functions can now be called on structs with zero size.
- Custom name/comment functions now work for local variables.
- After selecting a Script or a Template that has been run, the Variables tab now shows the list of variables created by that Script or Template.
- If an included file is opened and modified in the editor, the modified version is used when compiling instead of the disk version.
- Which warnings are displayed in the Output panel can be configured using the Compiling page of the Options dialog.
- When the application is starting up and files are being reloaded, the Output panel shows the results from all Templates that were run.
- The Template Results panel only shows the results from a syntax highlighting template if the Template was run directly (not as the result of opening a file).
- Can right-click on the Variables tab and select Clear to clear the results from a Script or Template.
- The InputString function now returns a UTF-8 string.
- Jump to Template Variable is now only shown on the Editor right-click menu when editing a hex file.
- Editor
- In the Text Editor, line numbers are now hidden by default and can be displayed by clicking 'View > Addresses > Show Addresses'.
- When addresses are hidden, place the mouse cursor over the address column for a second to see the line number in a hint popup.
- When addresses are hidden, a triangle marker indicates the last line in a file (this can be turned off by setting the Address End Marker to None in the Theme/Colors Options dialog).
- When addresses are hidden, a '-' marker indicates lines that are created by word-wrap.
- In the Text Editor, ruler labels are now hidden by default and can be shown using 'View > Ruler > Show Labels'.
- When ruler labels are hidden, place the mouse cursor over the ruler for a second to view the mouse and cursor position in a hint popup.
- In the Hex Editor, small arrows in the ruler show the current cursor position and can be turned off using 'View > Ruler > Show Arrows'.
- 'View > Tabs/Whitespace > Show Whitespace' now can be used to visualize linefeed types for each line.
- The different symbols drawn for Show Whitespace can be configured using the Text Editor page of the Options dialog.
- Breakpoints can be toggled by clicking the left-most column when editing a Script or Template.
- When right-clicking on the editor, the cursor is now moved before the right-click menu is shown.
- General
- The shortcut for opening the Base Converter was changed to Ctrl+F11.
- Updated the visual style of the Windows installer.
- Using Import Hex with Hex Text or Paste from Hex Text now supports data with more types of formatting.
- Options
- On the Text Editor page added the Show Whitespace section to control how linefeeds are drawn.
- On the Text Editor page added the Change Whitespace Symbols button to control which symbols are drawn for the different types of whitespace.
- On the Theme/Colors page added an option to control colors of breakpoints and the debug active line.
- On the Theme/Colors page added an option to control colors of the Address Hover Marker and Address End Marker (a triangle marker displayed on the last line when Show Addresses is turned off).
- On the Compiling page added the Configure button to control which warnings are displayed in the Output panel.
- On the Compiling page added the Breakpoints are Persistent toggle to control whether breakpoints are automatically saved to disk.
- On the Compiling page added the Show Variable Hints when Debugging option to display the value of variables when the mouse is placed over a variable name in the Text Editor.
- On the Compiling page added the When errors occur drop-down menu to control what action is taken when an error occurs in a Script or Template.
- On the Inspector page added the default date format 'dd/MM/yyyy'.
- Bugs
- Fixed scripts were not given permission to execute functions in DLLs in some cases.
- Fixed incorrect error message 'Incorrect function' when trying to load a file that does not exist on some machines.
- Fixed a crash replacing certain empty regular expressions with nothing.
- Fixed a possible crash editing a text file which contains a very long line (as reported by Kexu Wang of Fortinet's FortiGuard Labs).
- Fixed incorrect size of tabs in the Preferences dialog of the Help application.
- Fixed Save All does not try to save text in the Calculator to a file.
- Fixed the Inspector would sometimes not update properly after clicking a Floating Tab Group file and then a Template Results panel in the main window.
- Fixed possible crash with the Memset function (as reported by Kexu Wang of Fortinet's FortiGuard Labs).
- Fixed possible crash with ReadWLine/ReadLine/ReadWString/ReadString functions and very large files (as reported by Kexu Wang of Fortinet's FortiGuard Labs).
- Fixed 'Format > Comment Selection' now works with Python commenting.
- Fixed permission issue with the FileSaveRange function.
- Fixed up some inaccurate error messages when using invalid name/comment functions.
- Fixed a text color issue with the Output pane after calling the OutputPaneClear function.
- Fixed when replacing with nothing, sometimes not all replacements were listed in the Replace Results when 2 or more occurrences were found together.
- Fixed an empty struct could be executed twice in some cases.
|
|
For a full list of changes in other versions of 010 Editor, please see the Release Notes.

